GaussView
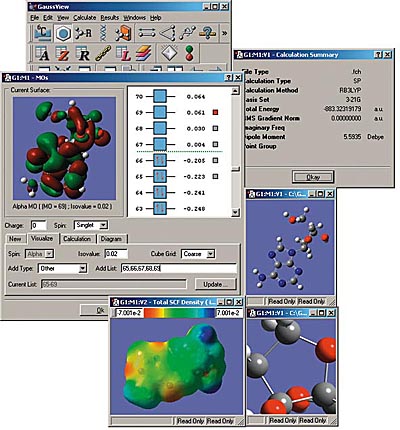
GaussView is an affordable, full-featured graphical user interface for Gaussian. With GaussView you can construct molecular systems of interest quickly and efficiently using its molecule building facility. You can also use it to set up and run Gaussian calculations and to visualize a variety of results.
GaussView incorporates an excellent molecule builder for rapidly building even very large molecules:
- Build molecules by atom, ring, group and amino acid.
- Import molecules from other sources by simply opening them.
- You can also add hydrogens automatically to structures originating from PDB files with excellent reliability.
- Rotate even very large molecules in three dimensions.
GaussView includes easy-to-use graphical interfaces for even the most complicated Gaussian input types: defining ONIOM layers, specifying unit cells for Periodic Boundary Conditions calculations, selecting orbitals for CASSCF calculations (see the lower left dialog in the illustration), and the like.
Gaussian jobs can be launched from within the user interface, and the calculation results can be examined when it finishes.
GaussView can visualize a variety of different Gaussian results, including:
- Optimized structures.
- Molecular orbitals.
- Electron densities, electrostatic potentials and other surfaces.
- IR and Raman spectra and the associated normal modes.
- Animated geometry optimization, IRC and trajectory results.
Visualizing Molecules & Reactions with GaussView
Visualizing Molecules & Reactions with GaussView
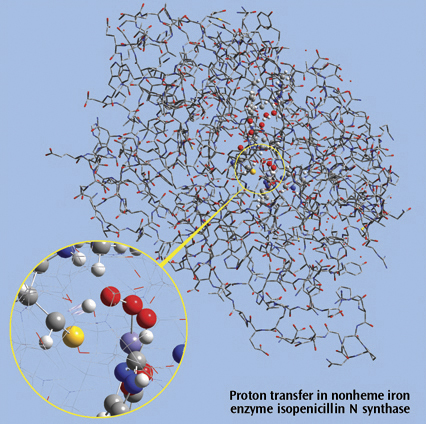
The picture on the right side is a close up of a proton transfer IRC animation
in nonheme iron enzyme isopenicillin N synthase (IPNS). This 5368-atom system
was studied with the ONIOM method in Gaussian, and the results were visualized
in GaussView. For illustration clarity, hydrogen atoms in the low layer are
omitted from display in both the close up and full molecule views. The ONIOM
high accuracy layer is visualized in ball-and-stick format; the low accuracy
layer is visualized in wire frame format in the close up view and in tube
format in the whole molecule view.
Reference: M. Lundberg, T. Kawatsu, T. Vreven, M. J. Frisch and K. Morokuma, JCTC 5 (2009) 222.
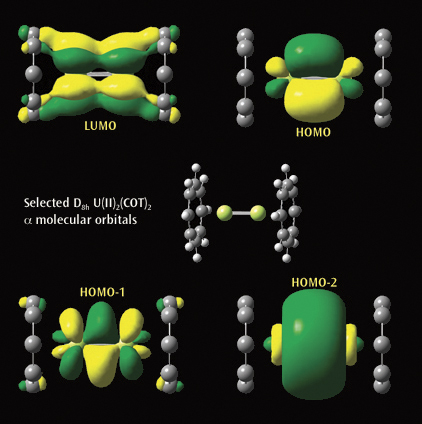
The second picture illustrtates a selected a molecular orbitals from a
Gaussian calculation on U(II)2(COT)2. Each U(II)COT monomer has 4 U valence
electrons available for metal-metal bonding: 2 electrons in f s-type MOs and
2 unpaired electrons in f d-type MOs. Beginning at the upper left and moving
clockwise, the MOs visualized in GaussView are the LUMO, HOMO, and the
second-lowest and next-lowest energy MOs below the HOMO; all have D8h symmetry.
Reference: J. Zhou, J. Sonnenberg and H. B. Schlegel, in preparation.
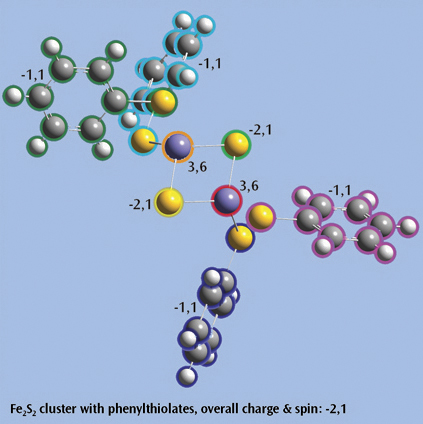
The last picture shows a Fe2S2 cluster with phenylthiolates—an open shell singlet system with charge -2—set up for a Gaussian fragment guess calculation to model antiferromagnetic coupling. Each iron atom and bridging sulfur atom is placed in its own fragment, and each phenylthiolate similarly defines a fragment, resulting in a total of eight fragments. The individual charge and spin multiplicity values for each fragment have been labeled in the illustration, and GaussView will place these values into the route section for the Gaussian job automatically.
Working with Plots and Spectra
Working with Plots and Spectra
In addition to the various surfaces we’ve already seen, GaussView presents predicted spectra and other numeric results as plots or graphs. Plots and views/animations are linked so that clicking on a point or peak in a plot/spectrum will display the corresponding frame in an animation or change the current view to that structure.
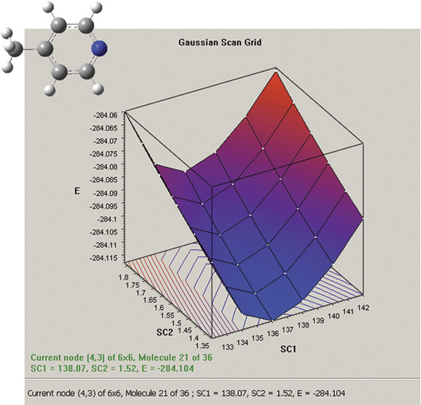
The graph on the picture to the right plots the results from a two-variable potential energy surface scan as a three-dimensional surface. The scan variables here are the C-methyl bond length and the C–N–C bond angle. The plot can be rotated and zoomed using normal mouse operations, and clicking on a point on the surface will activate the corresponding frame in the associated molecule group. The plot image and numerical data can both be saved to external files.
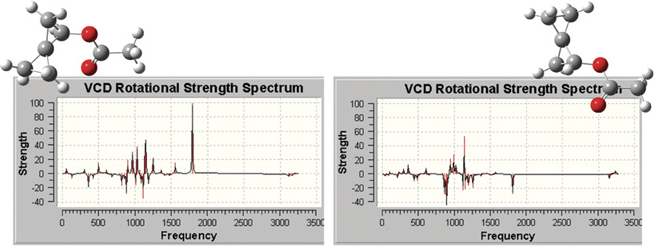
The plots below illustrate the spectra produced by GaussView, which include
all of the types that are predicted by Gaussian 09. Here we see the VCD
spectra for two enantiomers of (R)-spiropentyl acetate, a chiral derivative
of spiropentane.
Reference: F. J. Devlin, P. J. Stephens, C. Österle, K. B. Wiberg,
J. R. Cheeseman and M. J. Frisch, J. Org. Chem. 67 (2002) 8090.
GaussView also allows you to modify many plot properties (via the right-click context menu): invert the axes, scale the data, and so on. You can also zoom in on a portion of the plot or spectrum. In the example below, we zoom in on the portion of the spectrum outlined in green. The left illustration also shows the context menu.
Studying Periodic Systems
Studying Periodic Systems
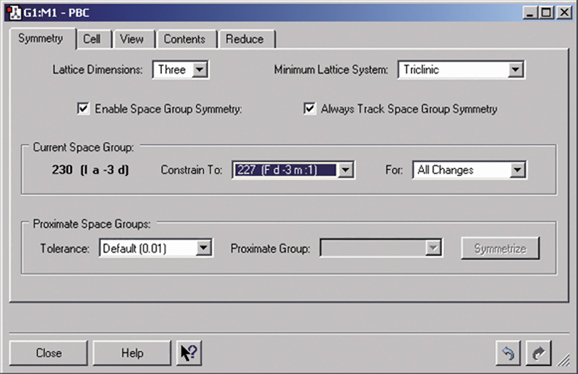
Gaussian can perform Periodic Boundary Conditions (PBC) calculations to model periodic systems in condensed phases: i.e., polymers, surfaces and crystals. GaussView provides a powerful facility for building such systems and generating their molecule specifications. The dialog below illustrates the space group symmetry capabilities; the space group for diamond has been selected for this 3D periodic structure.
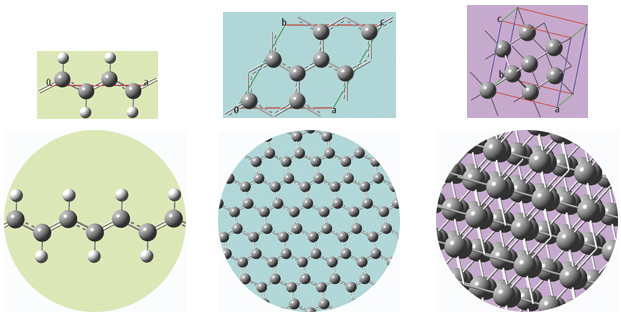
The unit cells for 1D, 2D and 3D periodic structures based on carbon are shown below, along with displays of multiple cells for the trans-polyvinyl acetate polymer, graphite sheet, and diamond crystal that they model. GaussView will set up a PBC calculation, automatically including the translation vectors within the molecule specification.


