")


Improved Visualization Labeling
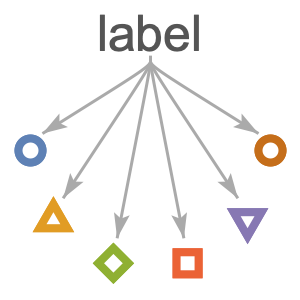
Labeling is a key feature in creating insightful plots and charts by allowing elements to have additional information such as names or values closely associated with them. Version 12 extends the classes of objects that can be labeled to include points, curves, parametric regions and surfaces in both 2D and 3D. Simultaneously, there are significant performance improvements in both faster labeling and better automatic positioning of labels. In addition to the automated labeling algorithms, the system still provides easy yet full control of how to place and style labels and callouts when needed.
- Charts can now use the full power of
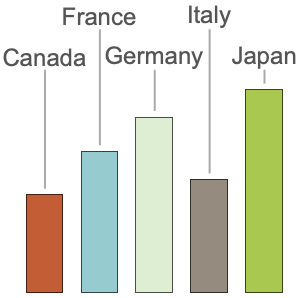
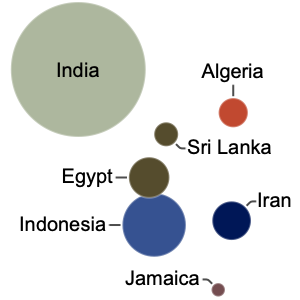
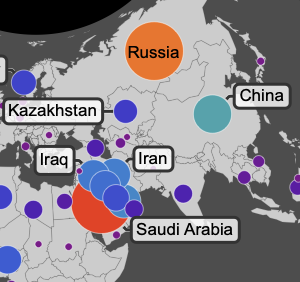
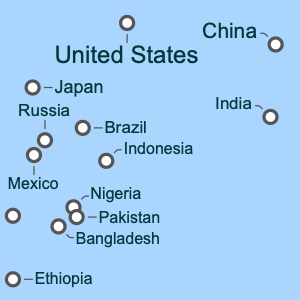
Callout. - Consider label sizes and available space when labeling points to avoid overlapping content.
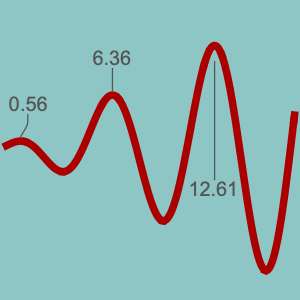
- Improved automatic labeling of curves to avoid intersections and other ambiguous locations.
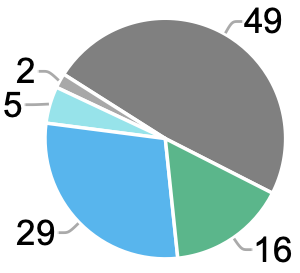
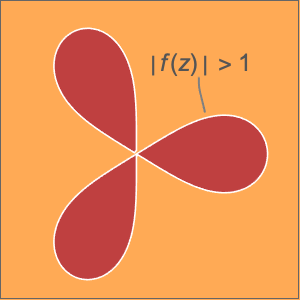
- Label the interior or boundary of regions in plots.
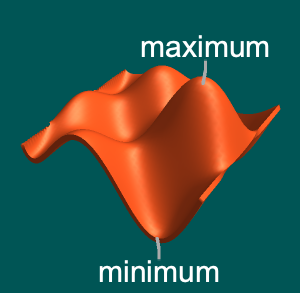
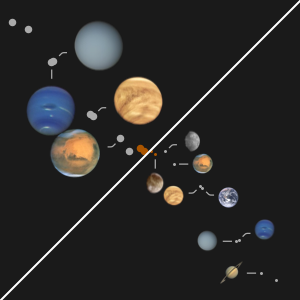
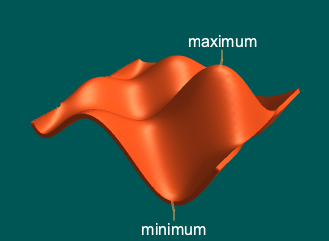
- Add labels and callouts to parametrized surfaces.
- Adjust the density of labels by controlling how big they can be.
- Give labels individual weights to affect which elements are labeled.
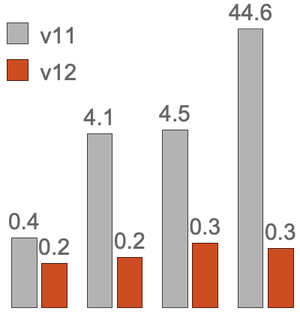
- Improved performance when labeling scenes with many elements.