


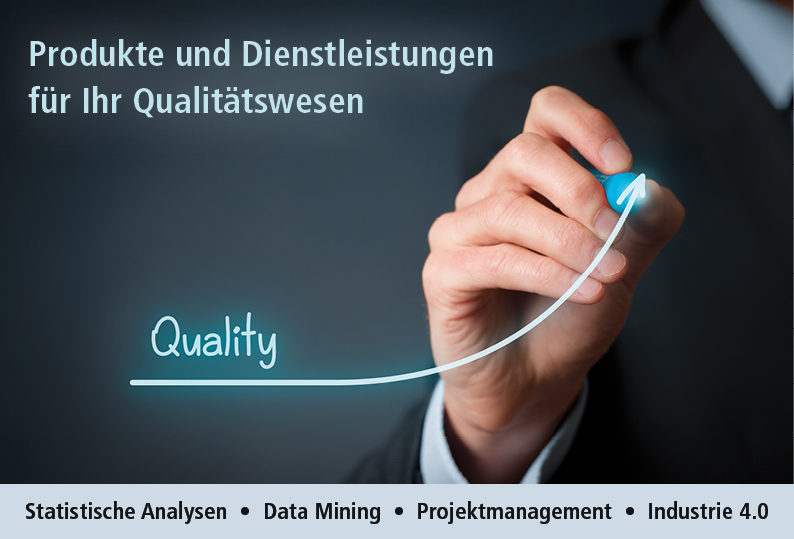
Products and Services for Your Quality Management
For more than 30 years, ADDITIVE has been supporting quality management with innovative standard software, individual applications and application-oriented training.
We offer you a wide range of statistical methods, for example, for evaluating measurement systems (MSA), entire processes (SPC) or for predicting the reliability of your own products. Furthermore, we optimize processes by using regression methods for smaller data sets and by using data mining algorithms for large data or countless influencing factors ("big data").
For the overall project management, we provide a standard tool, Minitab Workspace, which already contains countless tools from Lean, Six Sigma, DFSS etc. and even maps self-defined project philosophies.
To ensure optimal use of time, we support you on your way to Industry 4.0. Our task - in cooperation with you as our customer - is to correctly combine and analyze data from often many different machines and make statements or, if this has not already been done, to interconnect your measuring machines. We are also happy to help you with the automation of regularly required reports as well as predictive analysis and predictive maintenance.
Take the next step with us!
| Statistical Analyses | Data Mining |
|---|---|
|
Minitab Minitab Workspace |
Mathematica Salford Predictive Modeler |
| Project Management | Industry 4.0 |
|---|---|
| Minitab Workspace |
Services Aqua (ADDITIVE Quality Server) |
| Your contact persons | ||
|---|---|---|
| Daniel Fügner Six Sigma Black Belt Minitab & Companion Trainer |
Kai Gansel Data Mining Specialist Mathematica Trainer |
Ralf Rosenberger Manager Application & Sales |
Contact via Daniel Fügner: +49 6032 34956 - 35 –
To the article "Mit Algorithmen auf der Suche nach dem Datenschatz" at Quality Engineering
Products
- Minitab
Minitab is the globally best-known statistical software for quality management. It includes all essential statistical tools.
More about Minitab - Minitab Workspace
Minitab Workspace is a project management tool including countless tools. It can virtually cover all project philosophies.
More about Minitab Workspace - Salford Predictive Modeler by Minitab
The data mining technologies of the SPM software suite provide numerous algorithms that are considered indispensable by data science experts.
More about Salford Predictive Modeler - Mathematica
Mathematica is the integrated system for the complete development, calculation, simulation, analysis and documentation of technical problems.
More about Mathematica - Aqua (ADDITIVE Quality Server)
Monitor, evaluate and automatedly report quality features across processes via a database with web interface.
More about AQUA
Solution Topics
Below, you find a list of all the solution topics we can address with our various products.
- Graphs and Descriptive Statistics
A visual overview at the beginning of each analysis is highly recommended to get a feel for the data. - Hypothesis Tests
Are differences between samples (of suppliers, machines, before and after comparisons) really meaningful ("significant") or just random? - Measurement System Analysis
Is the measuring system (including its user) accurate and precise enough to distinguish parts and, thus, characterize the process? - Statistical Process Control
Is the process stable (free of outliers, trends, ...) at all, and how many rejects can I expect (via DPMA, PPM, Cpk/Ppk, ...)? - Survival and Reliability Analysis
How long do my products last at the customer’s, and how many returns should I expect in a certain period (e.g., the warranty period)? - Distribution Analysis
The correct distribution is essential! Relying solely on the normal (SPC) or Weibull (lifetime) distribution is extremely negligent. - Design of Experiments
Identification of the correlation between target variables and input variables with minimal experimental effort. - Regression & ANOVA
Identification of the relationship between target variables and input variables of historical data by building a mathematical model. - Monte Carlo Simulation
Which influencing variables cause the greatest contribution of variation for my target variable and which can be neglected? - Multivariate Analysis
How can I reduce my numerous influencing factors to a manageable amount? - Time Series
Identification of trends (e.g. wear and tear) and periodic fluctuations (e.g. seasonal sales figures) and derivation of forecasts. - Classification
"Supervised" and "unsupervised" clustering of frequently multidimensional data. - Neural Nets
The most powerful machine learning method for analyzing complex data such as images, speech or multivariate time series. - CART
Original implementation of Leo Breiman's classification and regression tree algorithm. - Random Forests
This algorithm utilizes the power of various alternative analyses, random strategies and ensemble learning. - MARS (Multivariate Adaptive Regression Splines)
This algorithm allows the results to be displayed in a similar way to conventional regression, while at the same time capturing non-linearity and interactions. - TreeNet
This algorithm is the most flexible and powerful data mining tool in the Salford Predictive Modeler and delivers extremely accurate models across the board. - Identification of most important parameters
... to prepare a classical statistical analysis and, thus, to set up a manageable/comprehensible model. - Correlations & Pattern Search
Analysis of pairwise correlations and higher order correlations to detect significant patterns in heterogeneous data. - Data Filtering & Visualization
Filtering and graphical presentation in two or more dimensions. - Dimension Reduction
Reduction of multidimensional data in order to separate the important ("information") from the unimportant ("noise"). - Covering various project philosophies
Whether Lean, Six Sigma, DFSS or an individual approach. Many tools are available by default or can be integrated individually by the user. - Quantitative tools from Six Sigma, Lean and so on
Whether Lean, Six Sigma, DFSS or an individual approach. Many tools are available by default or can be integrated individually by the user. - Templates for statistical results
Approximately 50 tools are available to document statistical results in a detailed and comprehensible manner. - Digital Transformation
Key competencies and technologies: Digital infrastructure and data analytics. - Digital Infrastructure
Central data model consisting of a network of different SQL and NoSQL databases, which are optimally adapted to your respective tasks. - Data Analysis
Our standard software packages, such as Mathematica and Minitab, for statistical and explorative data analysis will be connected to the infrastructure and adapted for use in the field. - Predictive Maintenance
Automatic analysis of permanently collected machine data for proactive maintenance of machines and reduction of downtimes.